Data
Experiments
Deflection
- The following video shows how the deflection data was collected

- The above video was entered into the tracker software to collect the following data.
| t | t1 | y |
|---|---|---|
| 2.091666667 | 0 | 4.95E-05 |
| 2.108333333 | 0.016666667 | 6.06E-05 |
| 2.125 | 0.033333333 | 1.03E-04 |
| 2.141666667 | 0.05 | 9.61E-05 |
| 2.158333333 | 0.066666667 | 1.50E-04 |
| 2.175 | 0.083333333 | 1.60E-04 |
| 2.191666667 | 0.1 | 1.72E-04 |
| 2.208333333 | 0.116666667 | 2.50E-04 |
| 2.225 | 0.133333333 | 2.89E-04 |
Table 1. Snippet of Deflection data
Complete data can be found here
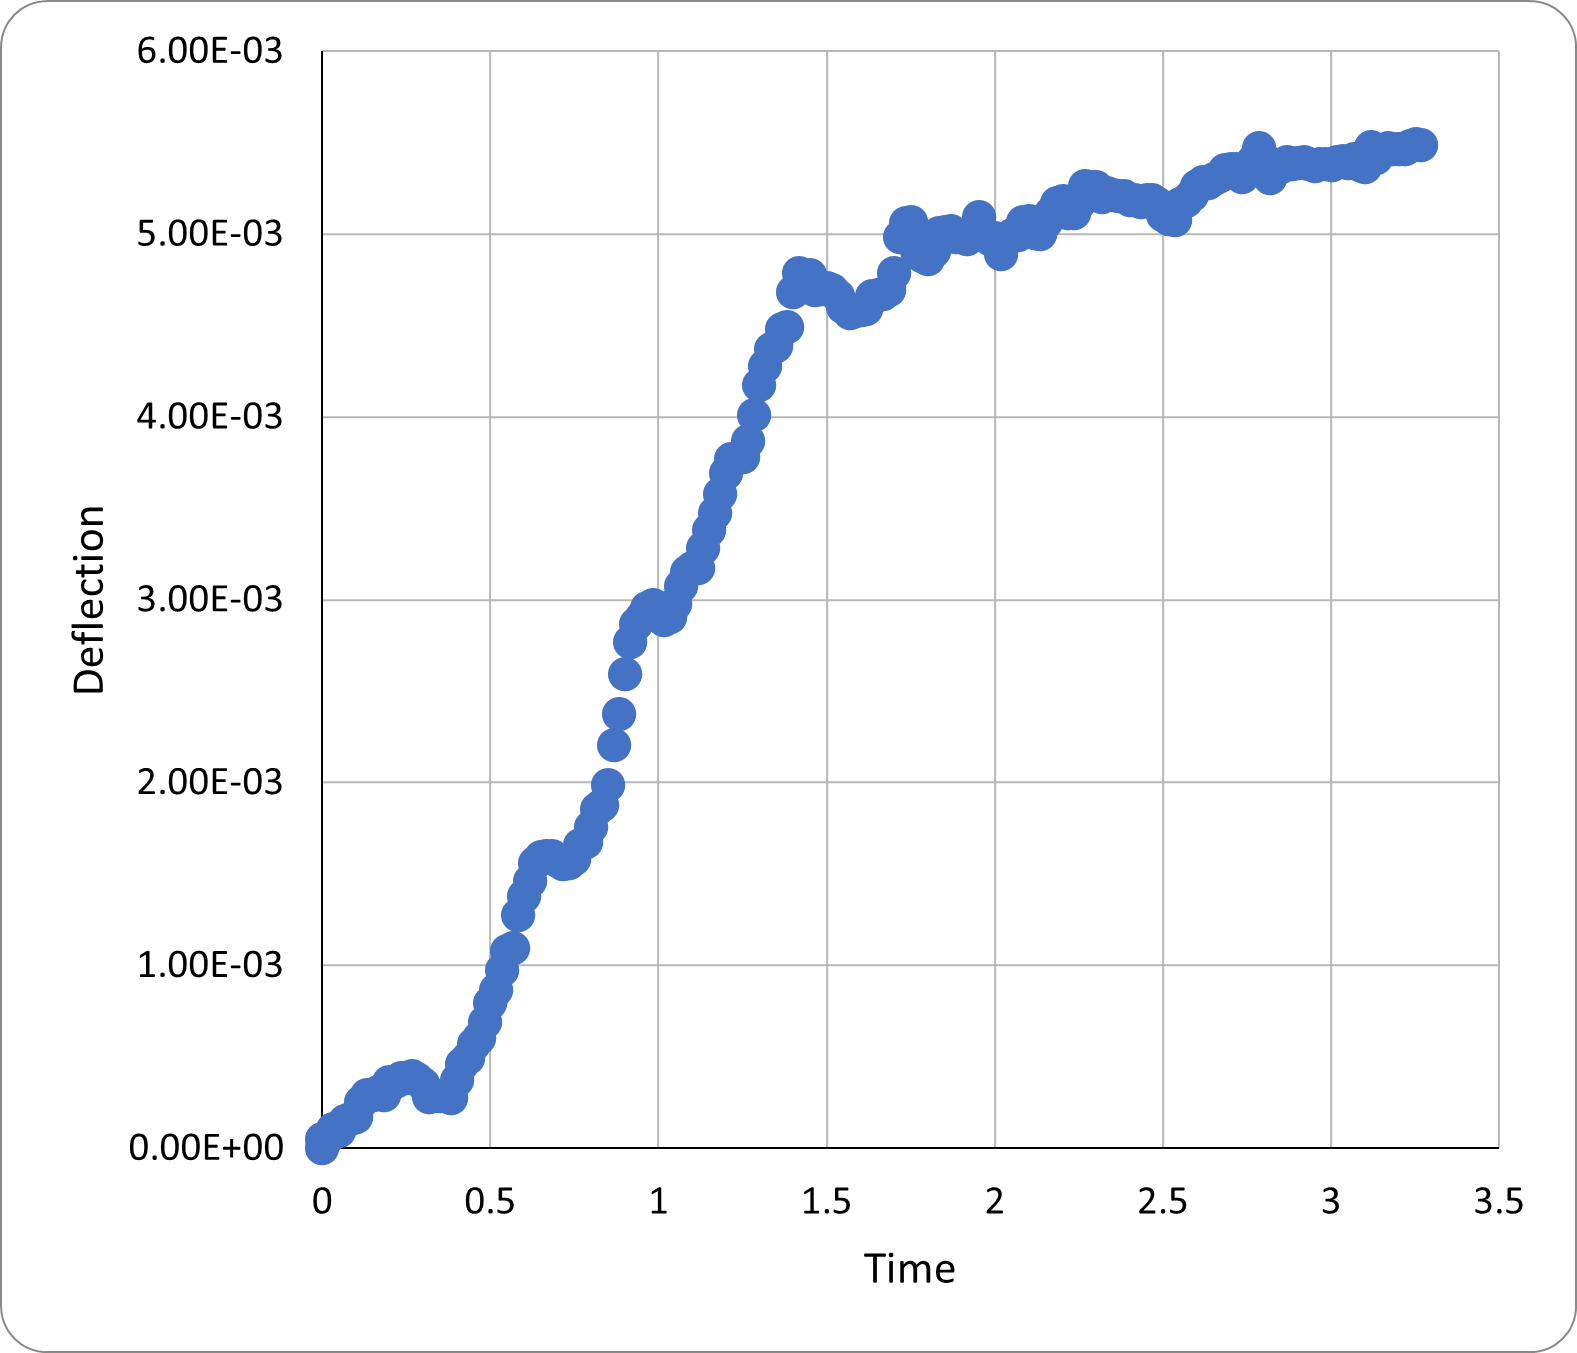
- The above data was plotted and the max deflection was found.
- The following Data was also collected to calculate the Beam Stiffness
| Weight | 0.095 | kg |
|---|---|---|
| Force | 0.93195 | N |
| Length | 0.048 | m |
| Maximum deflection | 0.0055 | m |
| Beam Stiffness | 169.445 | N/m |
Damping
- The following video shows how the damping data was collected

- The above video was entered into the tracker software to collect the following data.
| t | t(zero) | x | x(zero) |
|---|---|---|---|
| 4.27 | 0 | -0.038121153 | -0.032621153 |
| 4.286666667 | 0.01667 | -0.0371195 | -0.0316195 |
| 4.303333333 | 0.03333 | -0.035611738 | -0.030111738 |
| 4.32 | 0.05 | -0.033110659 | -0.027610659 |
| 4.336666667 | 0.06667 | -0.02880295 | -0.02330295 |
| 4.353333333 | 0.08333 | -0.024218688 | -0.018718688 |
| 4.37 | 0.1 | -0.01922408 | -0.01372408 |
| 4.386666667 | 0.11667 | -0.013662832 | -0.008162832 |
| 4.403333333 | 0.13333 | -0.007280394 | -0.001780394 |
Table 2. Snippet of Damping Data
Complete data can be found here
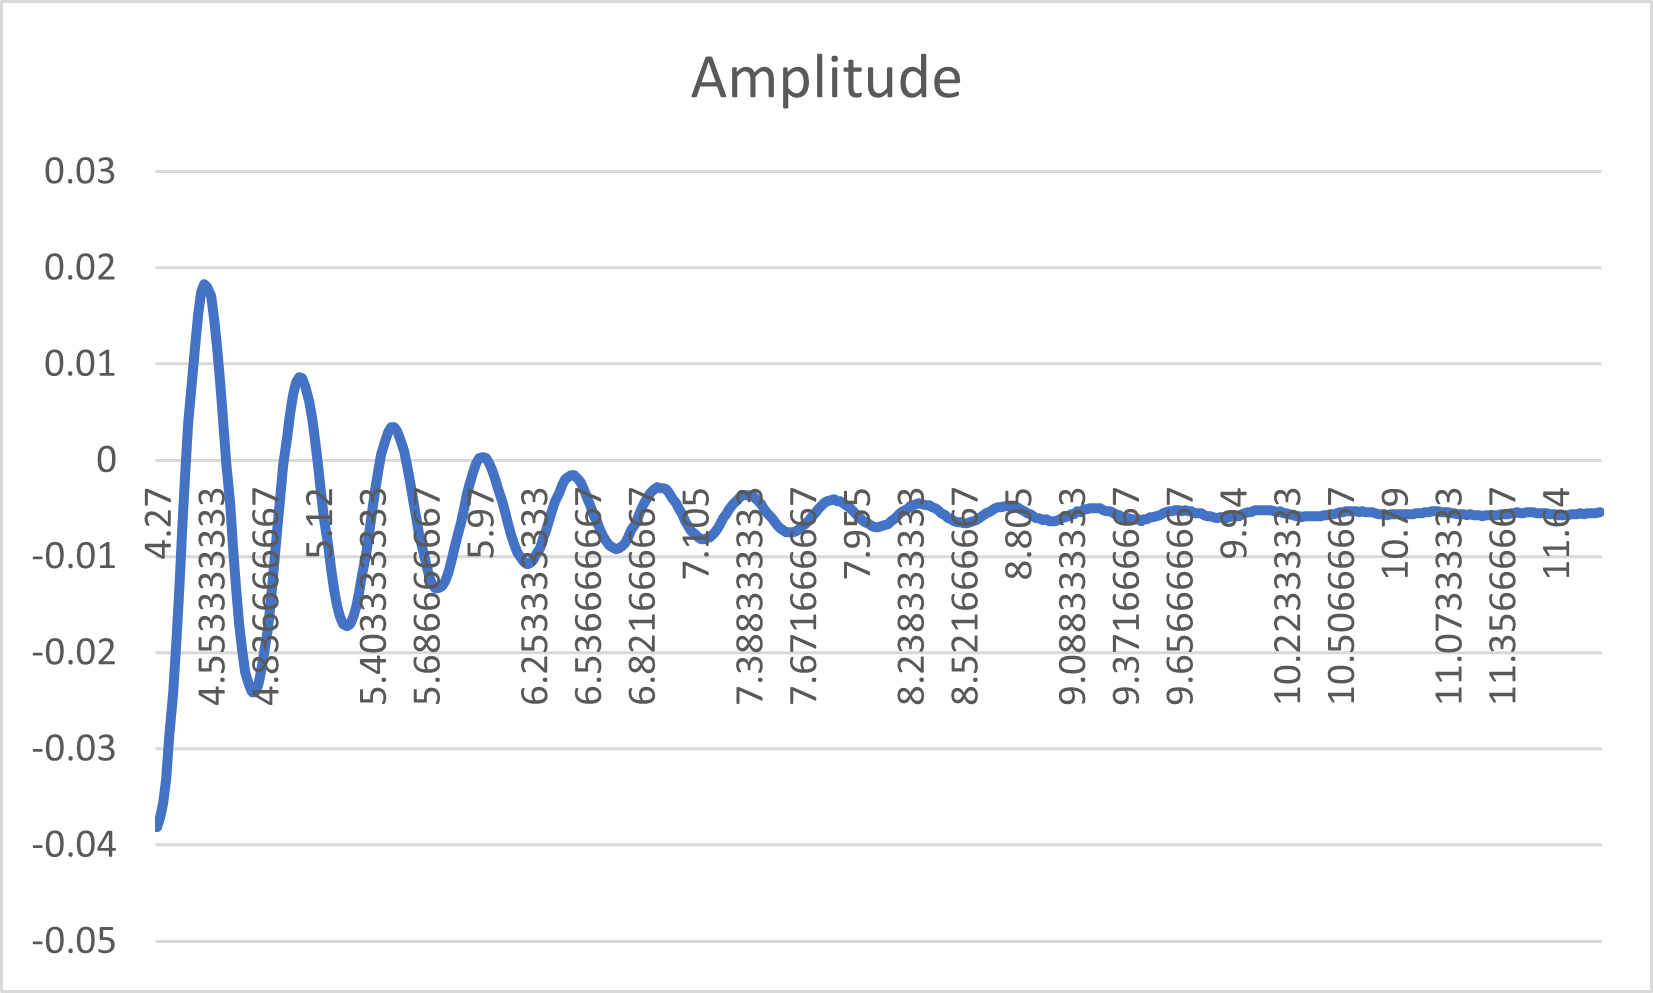
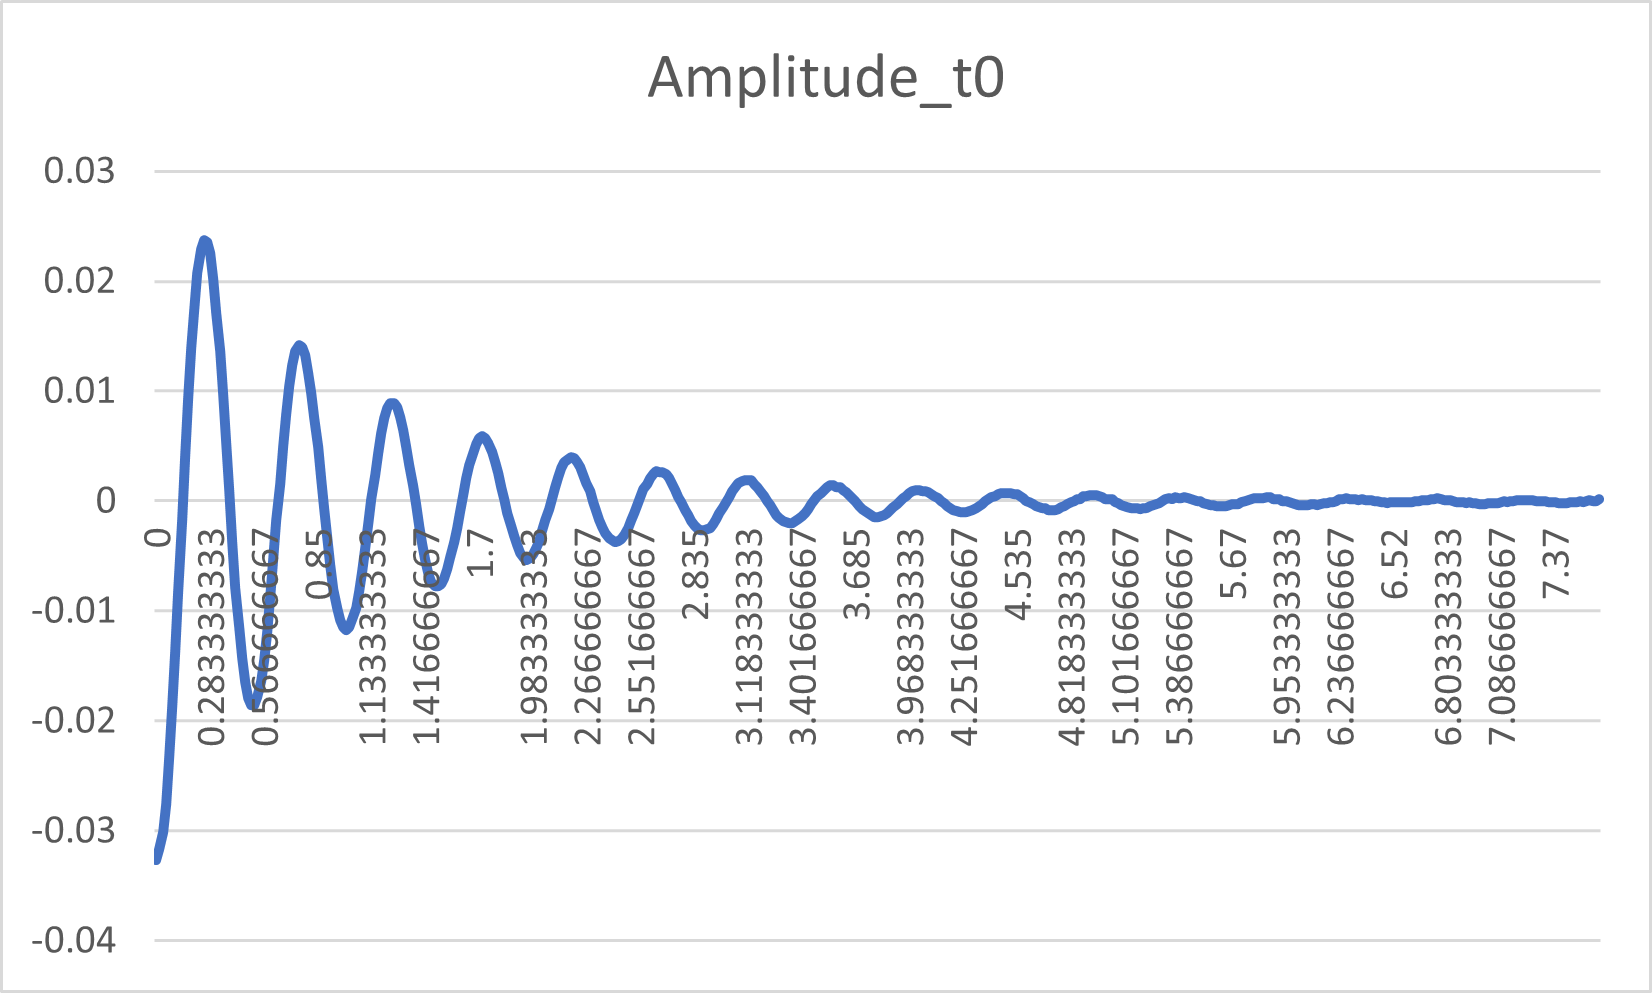
- The above data was plotted as below
Servo Torque
- The following video shows how servo torque was calculated